By: Slobodan P. Simonovic
Reported by: Tarinee Thongcharoen (M1)
Part 3 / Implementation of systems analysis to management of disasters: Chapter 5 / Simulation
Summary
The simulation models describe how a system operates are used to determine changes resulting from a specific course of action. The major components of a simulation model are the inputs or the quantities that drive the model, physical relationship which are the mathematical expressions of the relationships among the physical variables of the system being modeled, nonphysical relationships that define economic variables, operation rules: the rules that govern operational control and outputs which are the final product of operations on inputs by the physical and nonphysical relations in accordance with operating rules.
The system dynamics simulation approach relies on understanding complex interrelationships existing between different elements within a system, by developing a model that can simulate and quantify the behavior of the system. A system was define as a collection of elements that continually interact over time to form a unified whole. The underlying pattern of interactions between the elements of a system is called the structure of the system. The term dynamics refers to change over time. The difference between the two basic types of feedback is important in understanding dynamic behavior. A positive, or reinforcing, feedback loop reinforces change with even more change. This can lead to rapid growth at an ever-increasing rate. Positive feedback is undesirable and should be designed out. Figure 5.1a shows an example of a generic positive feedback loop, and Figure 5.1b shows the corresponding behavior. A negative, or balancing, feedback loop seeks a goal. If the current level of the variable of interest is above the goal, then the loop structure pushes its value down, while if the current level is below the goal, the loop structure pushes its value up. Figure 5.2a shows a negative feedback loop, and Figure 5.2b shows a typical pattern of behavior. It is also important to see the system from several viewpoints: as a physical arrangement, as a flow diagram and as a set of actions and consequences that can be shown graphically through time.
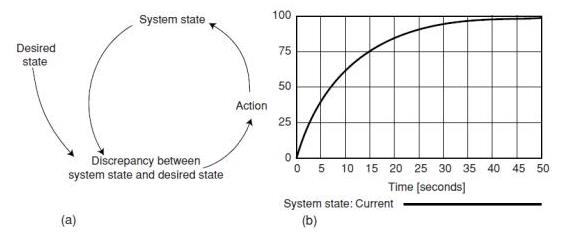
Figure 5.1 (a) Positive feedback loop; (b) system behavior.
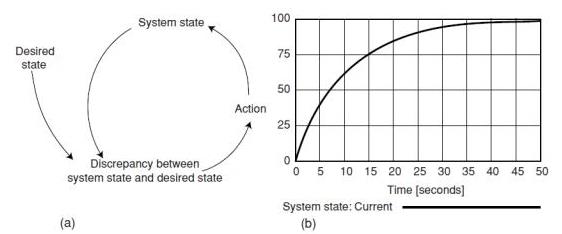
Figure 5.2 (a) Negative feedback loop; (b) system behavior.
There are six patterns of behavior which are shown in Figure 5.3 often show up, either individually or in combinations, in complex systems (such as disaster management) simulations. Delays are a critical source of dynamics in nearly all systems. There are two types of delays. Material delay captures the physical flow of material. Other delays represent the gradual adjustment of perceptions or beliefs called information delays. There are some basic practices that are quite commonly used for developing and using good quality system dynamics models the procedure listed below.
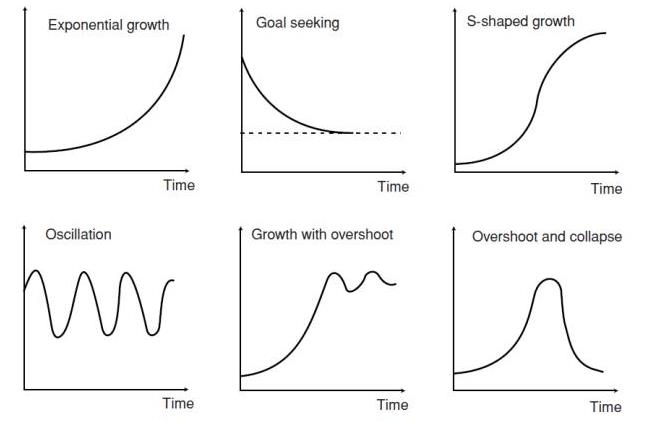
Figure 5.3 General patterns of system behavior.
- Issue statement: The issue statement is simply a statement of the problem that makes it clear what the purpose of the model will be.
- Variable identification : Identify some key quantities that will need to be included in the model for the model to be able to address the issues at hand.
- Reference modes: A reference mode is a pattern of behavior over time. Reference modes are drawn as graphs over time for key variables, but are not necessarily graphs of observed behavior.
- Reality check: Define some reality check statements about how things must interrelate.
- Dynamic hypotheses: A dynamic hypothesis is a theory about what structure exists that generates the reference modes.
- Simulation model: A simulation model is the refinement and closure of a set of dynamic hypotheses to an explicit set of mathematical relationships. Three steps of the modeling process introduced need a more detailed explanation: development of a causal loop diagram; development of the stock and flow diagram; and model simulation.
When an element of a system indirectly influence itself, the portion of the system involved is called a feedback loop. A map of the feedback structure of a simple system is a starting point for analyzing what is causing a particular pattern of behavior. It includes elements, and arrows, which are called causal links, linking them, and also includes a sign (either + or −) on each link. A causal link from one element A to another element B is negative (i.e., −) if either (a) A subtracts from B or (b) a change in A produces a change in B in the opposite direction. A causal link from one element A to another element B is positive (i.e., +) if either (a) A adds to B or (b) a change in A produces a change in B in the same direction. One of the main limitations of causal diagrams is their inability to capture the stock and fl w structure of systems. Stock and flow notation provides a general way to graphically characterize any system process. They characterize the state of the system and generate the information upon which decisions and actions are based. Stocks give systems inertia and provide them with memory. Stocks create delays by accumulating the difference between the inflow to a process and its outflow. By decoupling rates of flow, stocks are the source of disequilibrium dynamics in systems. Stocks are represented by rectangles Stocks can be used to depict both material and nonmaterial accumulations. The magnitudes of stocks within a system persist even if the magnitudes of all the activities fall to zero. Flows are used to depict activities. They are represented by a pipe pointing into or out of the stock as shown in figure 5.4. The units of measure can help you distinguish stocks from flows. Stocks are usually a quantity such as the number of boxes in storage. The associated flows must be measured in the same units per time; for example, the rate at which boxes are delivered or distributed from storage per day.
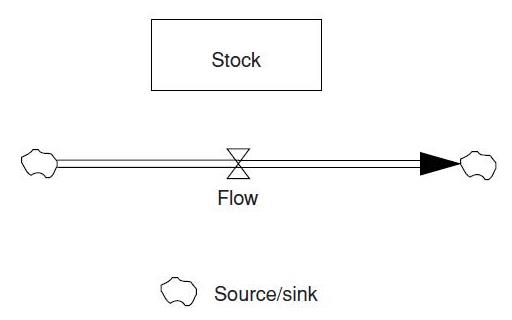
Figure 5.12 Stock and flow diagramming notation.
A set of principles that listed below can be helpful in understanding and implementing system dynamics simulations.
- A feedback system is a closed system.
- Every decision is made within a feedback loop.
- The feedback loop is the basic structural element of the system.
- A feedback loop consists of stocks and flow.
- Stocks are integrations.
- Stocks are changed only by the flow.
- Stocks and flow are not distinguished by units of measure.
- No flow can be measured except as an average over a period of time.
- Flows depend only on stocks and constants.
- Stock and flow variables must alternate.
- Stocks completely describe the system condition.
- A policy or flow equation recognizes a local goal toward which that decision strives.
The stocks and flows are building blocks of system dynamics simulation models. They allow the user to focus on assembling a model structure and assist in converting a structure into mathematical equations. The process of step-by-step solution of model equations is called simulation. Most dynamic behavior in social systems can only be represented by models that are nonlinear and so complex that analytical mathematical solutions are impossible. For such systems, only the simulation process using step-by-step numerical solution is available
The author gave an example of disaster management simulation in the case of flood evacuation simulation for the Red River basin in Manitoba, Canada. The modeling process required a very detailed consideration of major factors that affect human behavior during disasters. In Canada, the flood management process can be divided into three major phases: planning, emergency management, and post-flood recovery. Model relationships and all other necessary data were obtained through interviews conducted in the Red River basin immediately after the flood of 1997. The human decision-making process in response to a disaster warning can be divided into four psychological phase: concern, danger recognition, acceptance and evacuation decision. Figure 5.5 shows the conceptual framework of the behavioral flood evacuation model. The process through which initial conditions affect an individual’s behavior is complicated, and involves a chain of complex psychological reactions. The model considers two categories of households: those that have experienced disaster before and those that have not. There is a positive causal relationship between initial conditions and social factors, which is shown in Figure 5.6.
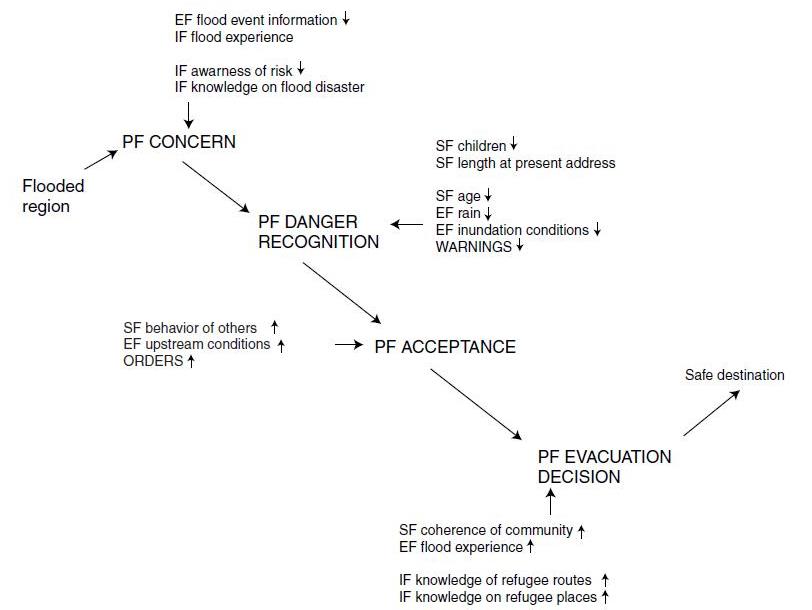
Figure 5.5 Conceptual framework of a behavioral model for evacuation planning.
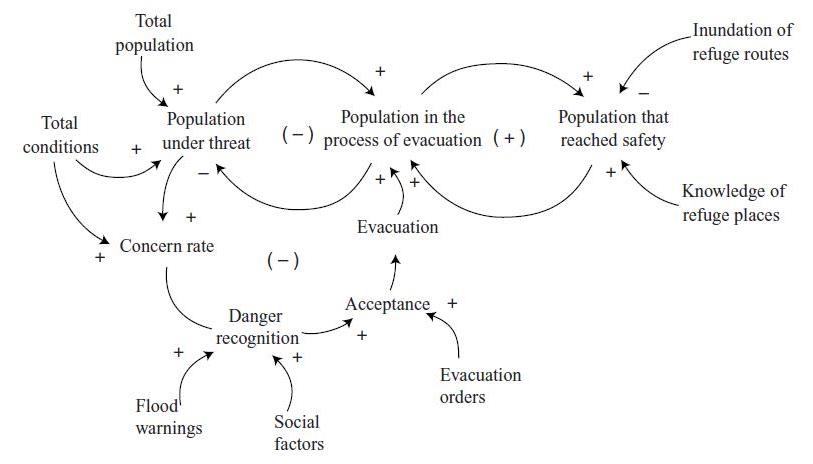
Figure 5.6 Causal diagram of a behavioral model for evacuation planning.
The system dynamics model is shown to be capable of simulating the effect of different flood evacuation policies. The main advantage of using the system dynamics approach for modeling human behavior during emergency situations is that by understanding how a particular structure of feedback loops is capable of generating the observed behavior we get insights into potential solutions. The flood evacuation model is available for use by emergency managers directly, and it is expected that it can lead to higher quality of decisions and a higher level of emergency preparedness. The ability to capture specific characteristics of the evacuation process during the flood emergency and to answer questions makes this model a powerful planning and analysis tool aimed at preventing loss of life and the minimization of material damage.
Reporter’s Own Thoughts
This chapter introduced the meaning and how to make a simulation in detail. According to my opinion, the theory is somewhat confusing since in order to make an accurate model we have to consider many factors that might lead to different results. Anyway, the writer also provides examples in each steps in the procedure of making the model which is easier to understand.