−CONTENTS−
- Experimental setup -
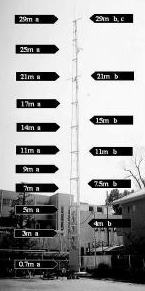
A sonic anemometer (USA1, Metek GmbH) and an infrared CO2/H2O open-path analyzer (LI-7500, LI-COR, Lincoln, NE, USA) were installed at a height of 29 m. The fluctuations of three-dimensional wind velocities, air temperature, and the concentrations of vapor and CO2 were measured at 8 samples sec-1. These data were logged to a data logger (CR10X, Campbell Sci., Inc., Logan, UT, USA) and stored on a computer. Upward and downward shortwave and longwave radiation intensities were measured separately using two sets of pyranometers (MS-42, 62, Eko Instruments) and pyrgeometers (MS-201, 202) at a height of 25 m. The precipitation was recorded using a tipping-bucket rain gauge (MW-10, Eko Instruments).
| Symbol | Variable | Instrument |
| a | CO2, q Ta |
LI-7000,LI-COR Unshielded fine gauge thermocouple (Omega,TypeE,f=0.05 mm) |
| b | u, v, w, Ts | Sonic anemometer (Market,USA1;Kaijo, SAT550) |
| c | CO2', q‘ | LI-7500,LI-COR |
2. Wind and turbulence profile
at We measured the wind vector (u, v, w), with w being the updraft and u and v being the horizontal wind speeds, and the sonic temperature (T), using 3-D ultrasonic anemometers at heights of 29, 21, 15, 11, 7, and 4 m. All data were sampled at 8 Hz. These data were logged to a data logger (CR10X, Campbell Sci.) and stored on a computer.
3. Temperature profile
at Air temperatures were measured at 28, 25, 21, and 14 m using unshielded, bare, 50-at μat m diameter thermocouples. The data were sampled at 1 Hz and 10-min averages were stored on a data logger. We used thermocouples with a diameter as small as possible to minimize the effect of radiation error to an estimated value of 0.1 K (Nakamura and Oke, 1988).
4. Profiles of water vapor and CO2
The vertical profiles of CO2 and vapor concentration were measured using a CO2/H2O gas-multiplexer system sampled sequentially air from 11 tower levels. We located 11 levels with inlets for CO2/H2O- concentration measurements. Air was sucked from each inlet at the tower through a Decabon tube down into an air-conditioned room at the bottom of the tower, where a gas multiplexer and a LI7000 closed path gas-analyzer (LI-COR) were operated. To minimize the effect of temporal changes of the background concentration, we setup a quick switching system (Fig. 3 and Table 3) similar to the one reported by Xu et al. (1999) and Vogt et al. (2005). Air from different levels was continuously drawn through all the lines while air from one selected height was monitored in the LI-7000. Each channel was sampled for 10 seconds but the first 3 seconds after switching were discarded. Mean values over the remaining 7 seconds were stored. The measurements for all 11 levels took 2 minutes. The data in down-to-top switching order and that in top-to-down switching order were averaged together to cancel out the effect of temporal change of concentration in the atmosphere. These procedures resulted in a cycle of 4 minutes for the mean CO2/H2O profiles at all 11 levels. The gas-analyzer was operated in differential mode, that is, by measuring continuously a zero gas in the reference cell. Every 60 minutes the standard gas for CO2 (500ppm) was supplied to the analyzer for 10 minutes for real time calibration. The intensive observation period was from November to December 2004.
Introduction
Site Information
Instruments
Publication
Research
Data Archive
Link